
Αρχείο:Centers8.png
Μέγεθος αυτής της προεπισκόπησης: 752 × 599 εικονοστοιχεία . Άλλες αναλύσεις: 301 × 240 εικονοστοιχεία | 602 × 480 εικονοστοιχεία | 1.000 × 797 εικονοστοιχεία.
Εικόνα σε υψηλότερη ανάλυση (1.000 × 797 εικονοστοιχεία, μέγεθος αρχείου: 781 KB, τύπος MIME: image/png)
|
|
Αυτό το αρχείο και η περιγραφή του προέρχονται από το Wikimedia Commons. Οι πληροφορίες από την σελίδα περιγραφής του εκεί εμφανίζονται παρακάτω. |
Σύνοψη
| Περιγραφή |
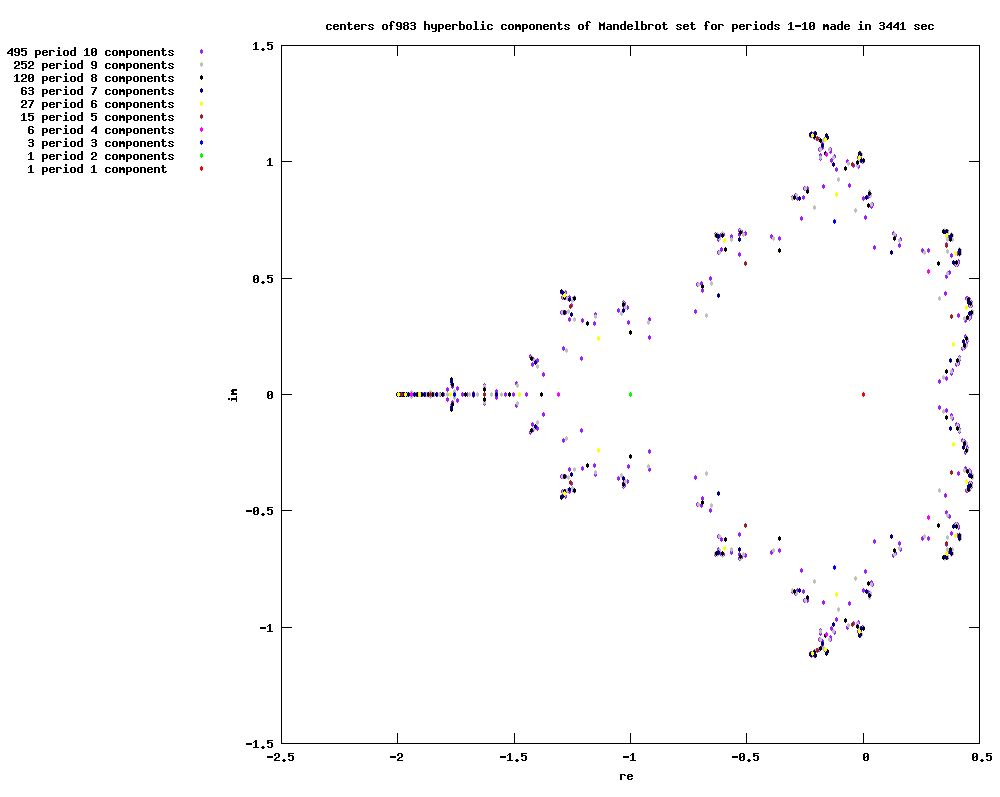
English: Centers of 983 hyperbolic components of Mandelbrot set with respect to complex quadratic polynomial for period 1-10
Polski: Punkty centralne 983 składowych zbioru Mandelbrota dla okresów 1-10
|
| Ημερομηνία | 4.01.2009 |
| Πηγή | Έργο αυτού που το ανεβάζει |
| Δημιουργός | Adam majewski |
Long description
Program input
No input is needed
Program output
- png file : centers_9_new.png
- txt files with numerical values of centers in big float Maxima format ( one file for each period)
Parts of the program
- definition of functions and constants
- loading packages
- for periods 1-period_Max
- computation of irreducible polynomials for each period
- computation of centers for each period : centers[period]
- saving centers to text files : centers_bf_p.txt
- computes number of centers for each period ( l[period]) and for all periods 1-period_Max ( N_of_centers)
- drawing to centers_9_new.png file
Software needed
- Maxima CAS
- cpoly package written in Lisp by Raymond Toy containing bfallroots function finding roots of complex polynomials by Jenkins-Traub algorithm. It is in file cpoly.lisp in src directory ( for example in Maxima-5.16.3\share\maxima\5.16.3\src )
- draw package - Maxima-Gnuplot interface by Mario Rodriguez Riotorto archive copy at the Wayback Machine
- gnuplot for drawing ( creates png file )
Tested on versions:
- wxMaxima 0.7.6
- Maxima 5.16.3
- Lisp GNU Common Lisp (GCL) GCL 2.6.8 (aka GCL)
- Gnuplot Version 4.2 patchlevel 3
Algorithm
See Wikibooks for detailes
Questions
- Can it be done for higher periods ? For me (GCL and wxMaxima) it fails for period 10 and precision[1] fpprec:150 or 256, but for period 10 and fpprec:300 I can run it from console or XMaxima, not wxMaxima
- How to save it as svg file ?
Compare with :
- centers 1-12 archive copy at the Wayback Machine made with Maxima, Eigensolve and Gnuplot
- centers of period 10 made with MPSolve and Gnuplot
- http://math.stackexchange.com/questions/2205922/critical-polynomial-roots-bigger-than-2
Maxima CAS src code
 /*
 Maxima batch script
 because :
 "this does works in the console and xMaxima, but not in wxMaxima " Julien B. O. - jul059
 http://sourceforge.net/tracker/index.php?func=detail&aid=1571099&group_id=4933&atid=104933
 handling of large factorials
 for periods >=10 run from console or XMaxima, not wxMaxima
 for example from console under windows run:
 cd C:\Program Files\Maxima-5.16.3\bin
 maxima
 batch("D:/doc/programming/maxima/batch/MandelbrotCenters/mset_centers_10_new_png.mac")$
 ----------------
 notation and idea is based on paper :
 V Dolotin , A Morozow : On the shapes of elementary domains or why Mandelbrot set is made from almost
 ideal   circles ?
 */
 start:elapsed_run_time ();
 load(cpoly);
 period_Max:10;


/* basic funtion  = monic and centered complex quadratic polynomial
 http://en.wikipedia.org/wiki/Complex_quadratic_polynomial
 */
 f(z,c):=z*z+c $

/* iterated function */
 fn(n, z, c) :=
  if n=1 	then f(z,c)
  else f(fn(n-1, z, c),c) $

 /* roots of Fn are periodic point of  fn function */
 Fn(n,z,c):=fn(n, z, c)-z $

/* gives irreducible divisors of polynomial Fn[p,z=0,c] */
 GiveG[p]:=
 block(
 [f:divisors(p),t:1],
 g,
 f:delete(p,f),
 if p=1
 then return(Fn(p,0,c)),
 for i in f do t:t*GiveG[i],
 g: Fn(p,0,c)/t,
 return(ratsimp(g))
  )$

 /* use :
 load(cpoly);
 roots:GiveRoots_bf(GiveG[3]);
 */
 GiveRoots_bf(g):=
 block(
 [cc:bfallroots(expand(%i*g)=0)],
 cc:map(rhs,cc),/* remove string "c=" */
 return(cc)
  )$

GiveCenters_bf(p):=
 block(
 [g,
 cc:[]],
 fpprintprec:10, /* number of digits to display */
 if p<7 then fpprec:16
 elseif p=7 then fpprec:32
 elseif p=8 then fpprec:64
 elseif p=9 then fpprec:128
 elseif p=10 then fpprec:300,
 g:GiveG[p],
 cc:GiveRoots_bf(g),
 return(cc)
 );
 N_of_centers:0;
 for period:1 thru period_Max step 1 do
 (
 centers[period]:GiveCenters_bf(period), /* compute centers */

/* save output to file as Maxima expressions */
 stringout(concat("centers_bf_",string(period),".txt"),centers[period]),
 l[period]: length(centers[period]),
 N_of_centers:N_of_centers+l[period]
 );

stop:elapsed_run_time ();
 time:fix(stop-start);


load(draw);

draw2d(
 file_name = "centers_10_new",
 terminal  = 'png,
 pic_width=1000,
 pic_height= 1000,
 yrange = [-1.5,1.5],
 xrange = [-2.5,0.5],
 title= concat("centers of ",string(N_of_centers)," hyperbolic components of Mandelbrot set for periods 1- ",string(period_Max)," made in ",string(time)," sec"),
 user_preamble="set size square;set key out;set key top left",
 xlabel     = "re ",
 ylabel     = "im",
 point_type    = filled_circle,
 points_joined = false,
 point_size    = 0.5,
 /* in reversed order of periods because number of centers is proportional to period */
 key = concat(string(l[10])," period 10 components"),
 color		  =purple,
 points(map(realpart, centers[10]),map(imagpart, centers[10])),
 key = concat(string(l[9])," period 9 components"),
 color		  =gray,
 points(map(realpart, centers[9]),map(imagpart, centers[9])),
 key = concat(string(l[8])," period 8 components"),
 color		  =black,
 points(map(realpart, centers[8]),map(imagpart, centers[8])),
 key = concat(string(l[7])," period 7 components"),
 color		  =navy,
 points(map(realpart, centers[7]),map(imagpart, centers[7])),
 key = concat(string(l[6])," period 6 components"),
 color		  =yellow,
 points(map(realpart, centers[6]),map(imagpart, centers[6])),
 key = concat(string(l[5])," period 5 components"),
 color		  =brown,
 points(map(realpart, centers[5]),map(imagpart, centers[5])),
 key = concat(string(l[4])," period 4 components"),
 color		  =magenta,
 points(map(realpart, centers[4]),map(imagpart, centers[4])),
 key = concat(string(l[3])," period 3 components"),
 color		  =blue,
 points(map(realpart, centers[3]),map(imagpart, centers[3])),
 key = concat(string(l[2])," period 2 components"),
 color		  =green,
 points(map(realpart, centers[2]),map(imagpart, centers[2])),
 key = concat(string(l[1])," period 1 component "),
 color		  =red,
 points(map(realpart, centers[1]),map(imagpart, centers[1]))
 )$
References
Αδειοδότηση
Εγώ, ο κάτοχος των πνευματικών δικαιωμάτων αυτού του έργου, το δημοσιεύω δια του παρόντος υπό τις εξής άδειες χρήσης:
Το αρχείο διανέμεται υπό την άδεια Creative Commons Αναφορά προέλευσης-Παρόμοια διανομή 3.0 Μη εισαγόμενη
- Είστε ελεύθερος:
- να μοιραστείτε – να αντιγράψετε, διανέμετε και να μεταδώσετε το έργο
- να διασκευάσετε – να τροποποιήσετε το έργο
- Υπό τις ακόλουθες προϋποθέσεις:
- αναφορά προέλευσης – Θα πρέπει να κάνετε κατάλληλη αναφορά, να παρέχετε σύνδεσμο για την άδεια και να επισημάνετε εάν έγιναν αλλαγές. Μπορείτε να το κάνετε με οποιοδήποτε αιτιολογήσιμο λόγο, χωρίς όμως να εννοείται με οποιονδήποτε τρόπο ότι εγκρίνουν εσάς ή τη χρήση του έργου από εσάς.
- παρόμοια διανομή – Εάν αλλάξετε, τροποποιήσετε ή δημιουργήσετε πάνω στο έργο αυτό, μπορείτε να διανείμετε αυτό που θα προκύψει μόνο υπό τους όρους της ίδιας ή συμβατής άδειας με το πρωτότυπο.

|
Παραχωρείται η άδεια προς αντιγραφή, διανομή και/ή τροποποίηση αυτού του εγγράφου υπό τους όρους της Άδειας Ελεύθερης Τεκμηρίωσης GNU, Έκδοση 1.2 ή οποιασδήποτε νεότερης έκδοσης δημοσιευμένης από το Ίδρυμα Ελεύθερου Λογισμικού· χωρίς Απαράλαχτους Τομείς, χωρίς Κείμενα Εξωφύλλου, και χωρίς Κείμενα Οπισθοφύλλου. Αντίγραφο της άδειας περιλαμβάνεται στην σελίδα με τίτλο GNU Free Documentation License. |
Μπορείτε να επιλέξετε την άδεια της προτίμησής σας.
Ιστορικό αρχείου
Κλικάρετε σε μια ημερομηνία/ώρα για να δείτε το αρχείο όπως εμφανιζόταν εκείνη τη στιγμή.
| Ώρα/Ημερομ. | Μικρογραφία | Διαστάσεις | Χρήστης | Σχόλια | |
|---|---|---|---|---|---|
| τελευταία | 10:02, 6 Μαΐου 2017 | | 1.000 × 797 (781 KB) | Shiftchange | Cropped white space above and below image. |
| 13:24, 30 Μαρτίου 2009 |  | 1.000 × 1.000 (13 KB) | Soul windsurfer | centers for periods 1-10 | |
| 13:53, 15 Μαρτίου 2009 |  | 1.000 × 1.000 (10 KB) | Soul windsurfer | periods 1-9 | |
| 12:33, 4 Ιανουαρίου 2009 |  | 1.000 × 1.000 (9 KB) | Soul windsurfer | {{Information |Description={{en|1=Centers of hyperebolic components of Mandelbrot set with respect to complex quadratic polynomial for period 1-8 }} {{pl|1=Punkty centralne składowych zbioru Mandelbrota dla okresów 1-8 }} |Source=Own work |Author=[[User |
Συνδέσεις αρχείου
Τα παρακάτω λήμματα συνδέουν σε αυτό το αρχείο:
Καθολική χρήση αρχείου
Τα ακόλουθα άλλα wiki χρησιμοποιούν αυτό το αρχείο:
- Χρήση σε en.wikipedia.org
- Χρήση σε en.wikibooks.org
- Χρήση σε pl.wikipedia.org